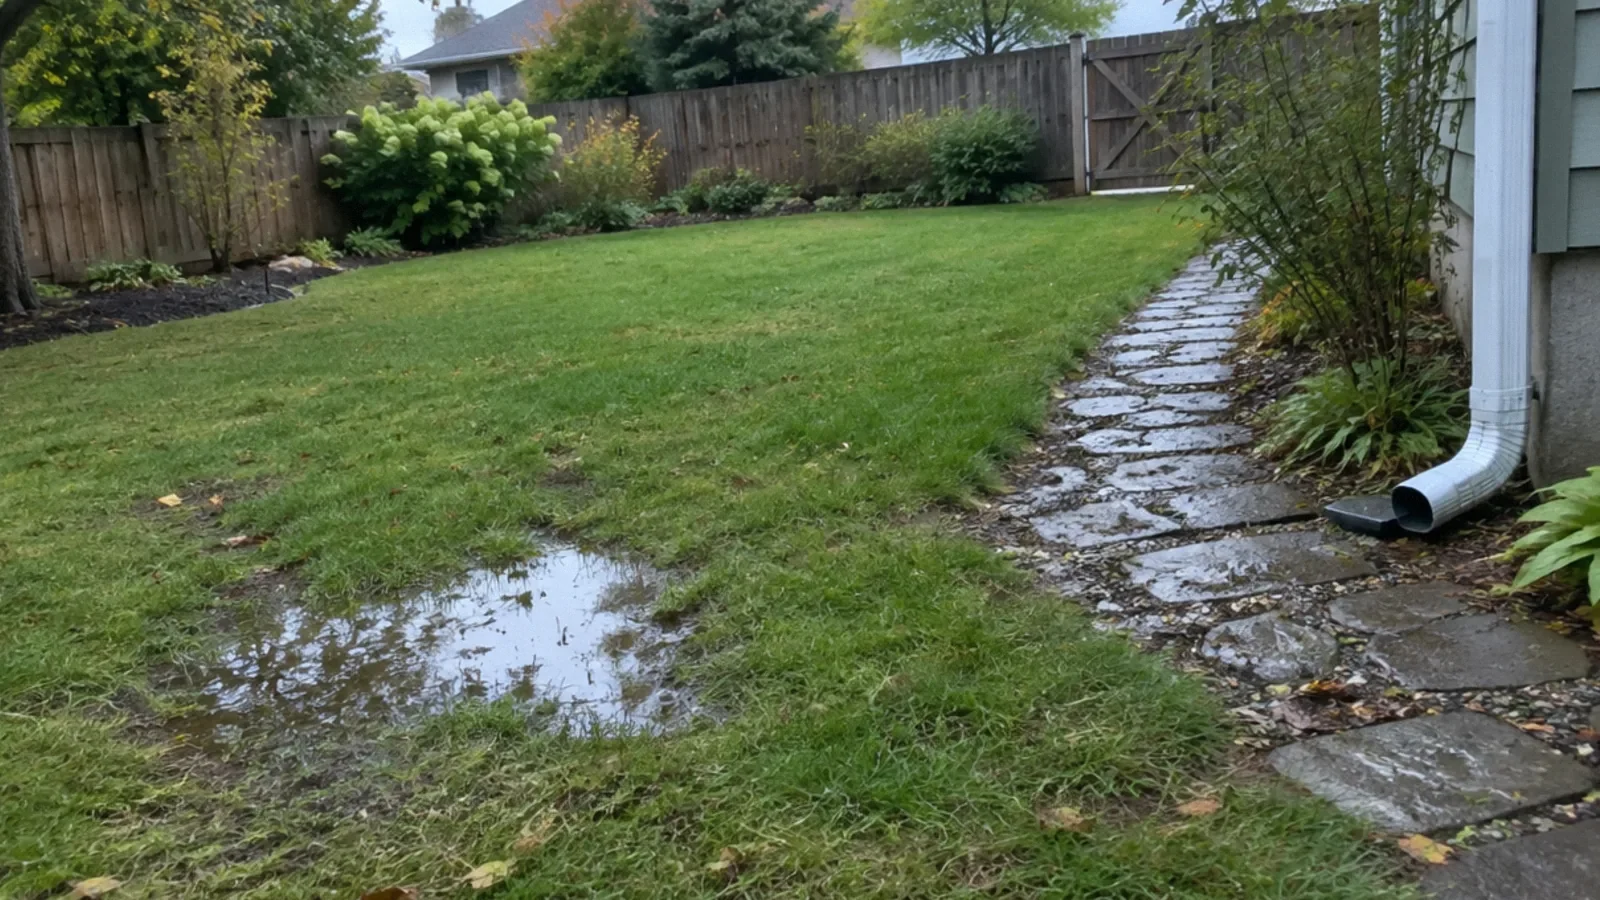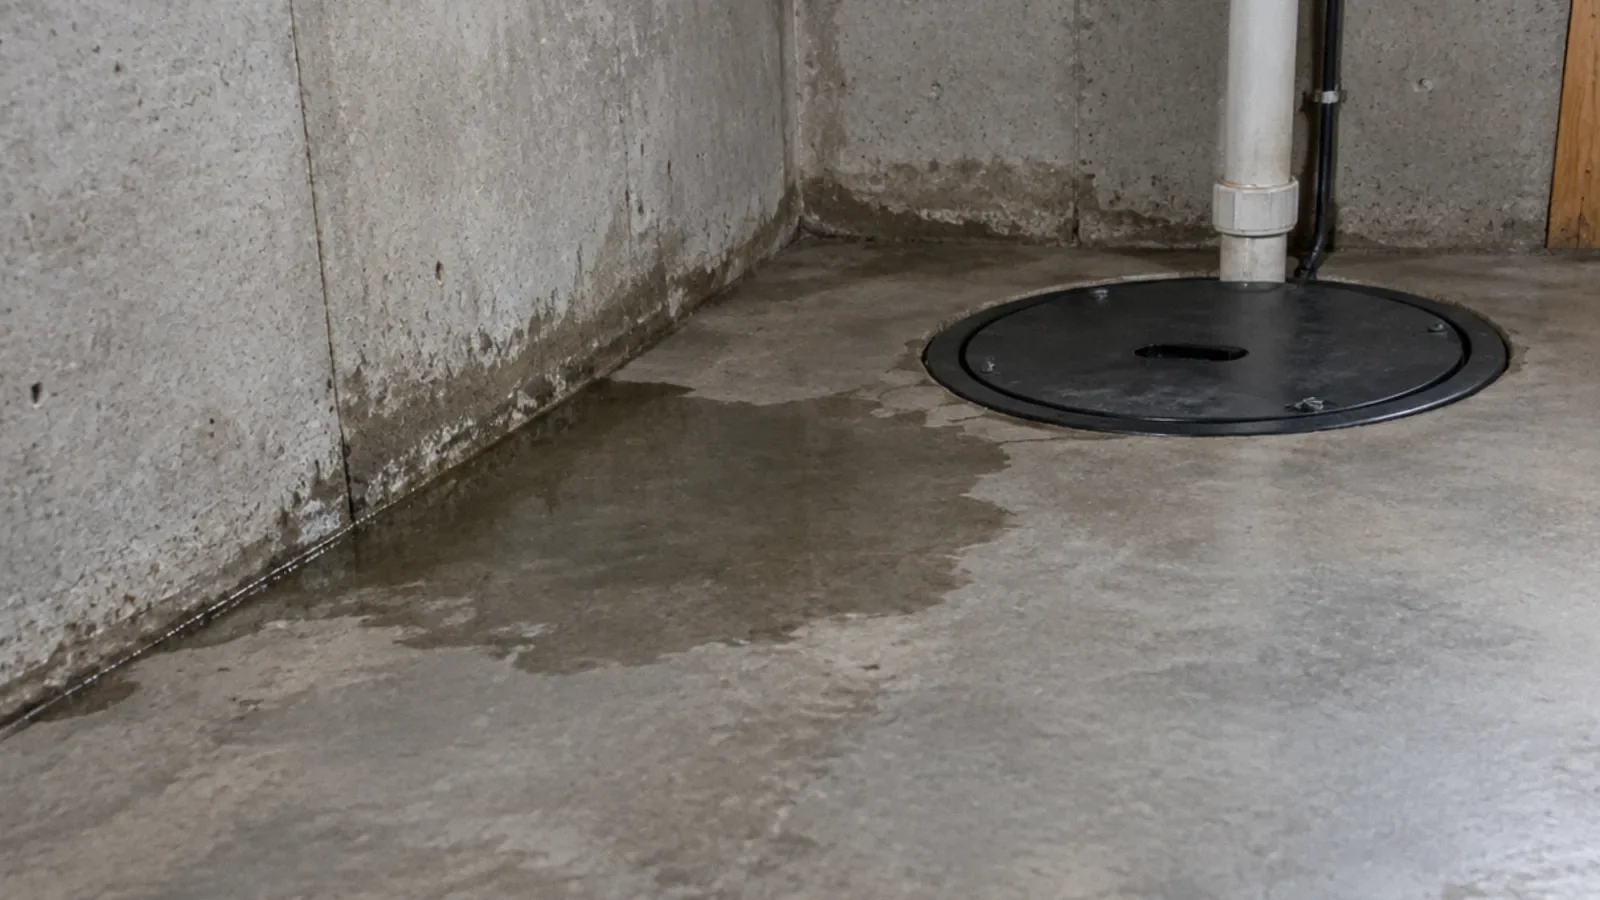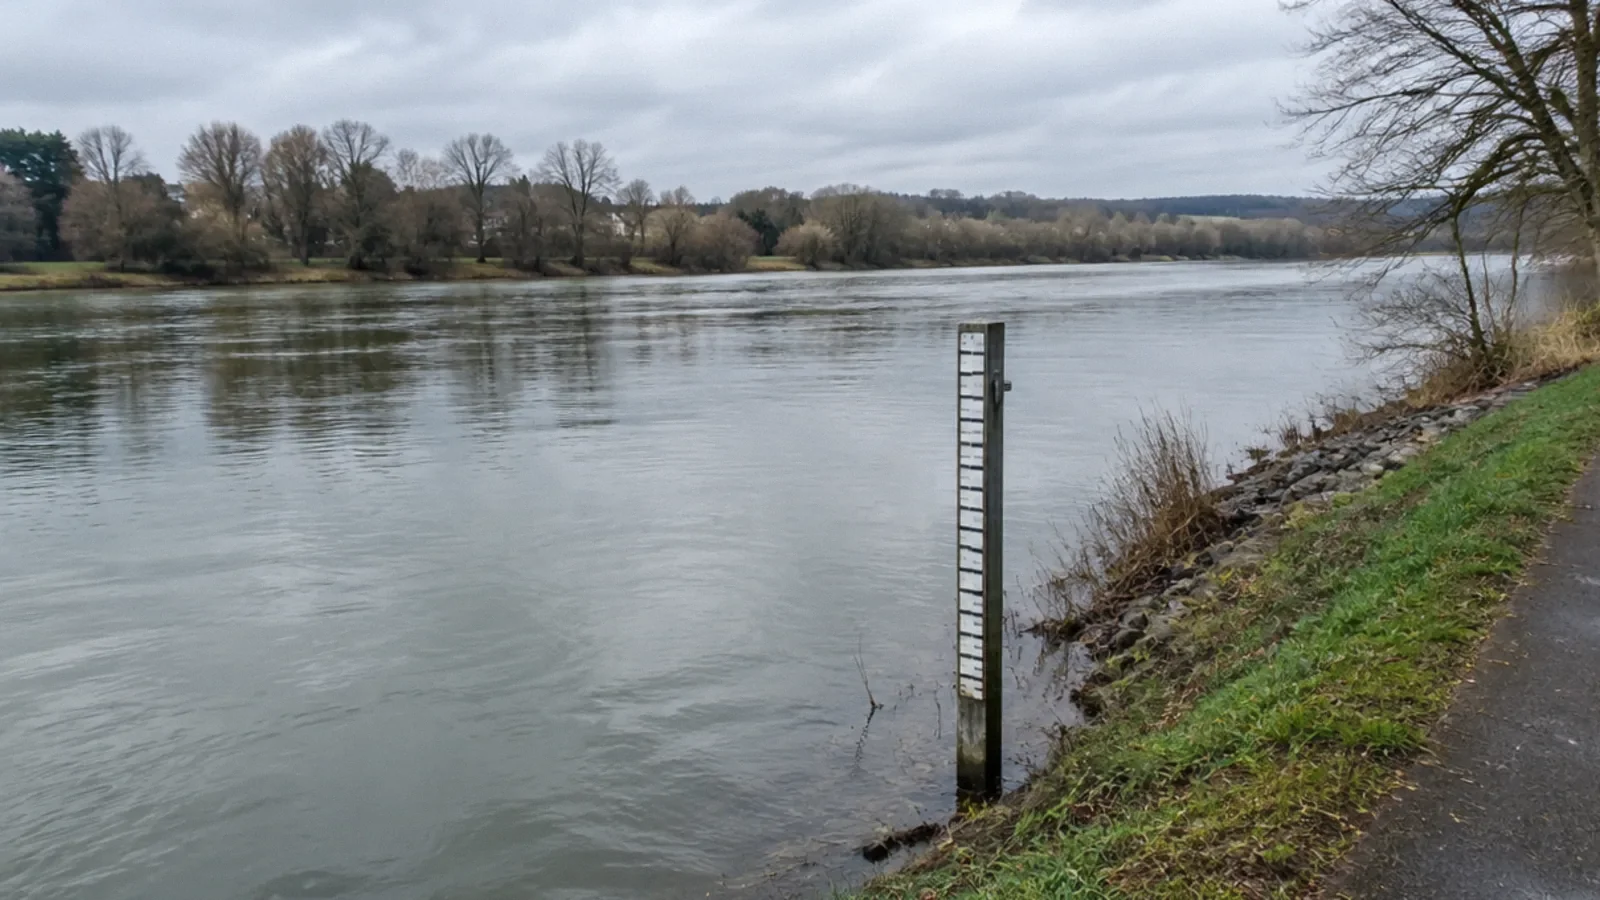
Flooding is water overflowing onto land that is normally dry. Floods can occur in many settings, including rivers, coasts and urban areas. Water level and flow are measured differently, and the state with the most floods depends on the dataset, time period and definition of an event.
Flooding can happen in many places
NOAA defines flooding as water overflowing onto land that is normally dry. Heavy rain, snowmelt, coastal water, drainage limitations and other conditions can contribute. A location does not have to be next to a large river to experience flooding.
Flash flooding can develop rapidly, while other floods rise over a longer period and may last days or more. The local terrain, rainfall, ground conditions and drainage network affect the outcome. Follow local warnings rather than assuming that a familiar location is safe.
Different kinds of flood
River flooding occurs when water rises beyond the channel and affects normally dry land. Coastal flooding can be influenced by storm surge, tides and waves. Intense rainfall can overwhelm urban drainage even away from a river. More than one process may occur during the same storm.
A backyard puddle, a flooded road and water entering a home require different responses. None can be assessed reliably from a national average. Check the local forecast, official flood maps and observed conditions, and follow evacuation instructions.
How river level is measured
A streamgage records the height of the water surface relative to a reference point; this measurement is called stage or gage height. The reference is specific to the site, so the number should not be compared casually with the floor height of a nearby house or a different gauge.
NOAA’s hydrograph resources show observed and forecast levels and local impacts for many gauge locations. A forecast can change, and a local threshold applies to that location. Use the latest official information and understand that a gauge does not describe every street.
Water level and flow are not the same
Streamflow, or discharge, describes the volume of water passing a point over time, commonly in cubic feet per second in the United States. USGS develops a relationship between gauge height and discharge using measurements; this relationship is called a rating curve.
The relationship can change as a channel changes, and extreme events can make direct measurement difficult. A higher stage at one location cannot automatically be translated into the same discharge at another. Local specialists interpret the measurements and their uncertainty.
Which state has the most floods?
There is no single useful answer without specifying whether the comparison counts reported events, fatalities, insured losses, affected properties or another measure, and which years and flood types are included. Rankings can change with a major storm and with how events are recorded.
NOAA’s weather statistics and Storm Events Database provide event-specific information, while other programs measure different outcomes. When comparing states, cite the dataset, period and metric rather than presenting one state as permanently first. Local risk is not determined by a state ranking.
Why an annual chance is not a schedule
Flood probability estimates describe a statistical chance under the assumptions and data used; they do not mean a flood will occur on a predictable anniversary. Multiple damaging floods can occur close together, and conditions or maps can change.
Use current local flood information and speak with the relevant authority or insurance professional about a specific property. A map is an important planning tool but does not guarantee that water cannot reach a location outside a mapped zone.
Safety around floodwater
Never drive or walk through flooded roads. Depth, current, pavement condition and hidden hazards may be impossible to judge. Follow road closures and move to higher ground when instructed. Keep away from downed lines and water near electrical equipment.
Floodwater may contain sewage, chemicals or sharp debris. CDC advises avoiding contact with water that may be contaminated. Do not enter a flooded building until officials say it is safe, and follow current cleanup guidance.
Prepare for the local risk
Know local warning channels, routes and any household assistance needs. Store important records safely and review the relevant insurance policy before a storm; flood coverage can differ from ordinary homeowners coverage. Confirm terms with the insurer.
Maintain accessible gutters and drainage where safe, but do not assume a small property improvement protects against every flood. A local professional can assess recurring water pathways and suitable measures for the site.
What is storm surge and how far inland can it go?
Storm surge is an abnormal rise in coastal water driven primarily by a storm’s winds. Storm tide combines the surge with the astronomical tide; waves can add impacts above that water level. NOAA notes that surge can travel inland through bays, rivers and canals.
There is no single safe distance from the coast. The storm’s size, speed, track, coastal shape, elevation and waterways affect how far water reaches. NOAA describes the 1957 Hurricane Audrey surge reaching as far as 25 miles inland in some locations, a historical example rather than a prediction for another storm. Follow current local evacuation instructions and surge forecasts.
Eleven flood facts and where to verify them
1. Flooding is water covering normally dry land; NOAA’s Flood Basics explains the definition and different causes. 2. Flash floods can develop in a short time after intense rainfall; the National Weather Service notes they commonly develop within six hours. 3. Floodwater can arrive downstream where it is not raining, as the NWS Albuquerque flood preparedness page explains.
4. River flooding can result from sustained rain or snowmelt. 5. Urban rainfall can overwhelm drainage away from a river. 6. Storm surge is an abnormal rise driven primarily by storm winds; storm tide also includes the astronomical tide. NOAA’s storm surge overview explains this distinction.
7. A streamgage’s stage is a water height relative to a local reference, not the volume flowing. 8. USGS estimates discharge using a site-specific relationship between stage and measured flow; this relationship can change. 9. A 1% annual chance is a chance in each year, not a promise of one flood every century.
10. Six inches of fast-moving water can knock a person down, according to NWS; never test the depth. 11. Floodwater can hide a washed-out road, making driving or walking into it dangerous. These are distinct observations, not thresholds that make shallower water safe. See the linked NOAA, USGS and NWS sources below.
Check a property and compare regions responsibly
Search the address at FEMA’s Flood Map Service Center and check the effective map and any local updates with the floodplain manager. A mapped zone is not a guarantee: intense rainfall and surface runoff can flood locations outside mapped high-risk areas. Check local drainage history and official warnings as well.
A credible state or country ranking needs a comparable dataset, flood definition, metric and period. Event reports, deaths, economic losses and properties at risk measure different things. A defensible comparable state or international ranking was not established here, so no state or country is named as a permanent leader. NOAA’s Storm Events Database is a starting point for a specified event-count analysis, subject to reporting limitations.
Your next-step checklist
- Check current local flood alerts and gauge information.
- Understand that stage and discharge are different measurements.
- Never enter a flooded road.
- Review a property’s local risk and insurance before an emergency.
Related questions
Where do floods happen most?
Floods occur in river, coastal, urban and other settings. A state ranking depends on the dataset, period and whether events, deaths or losses are counted.
How are floods measured?
Gauges can measure water level, or stage, and USGS uses site-specific relationships to estimate flow, or discharge.
Can flooding happen away from a river?
Yes. Intense rainfall can overwhelm drainage and flood urban or low-lying areas.
Does a mapped low-risk area mean flooding is impossible?
No. Maps have limitations and conditions can change; follow local warnings and assess the property’s specific setting.
How far inland can storm surge go?
It depends on the storm and terrain and can travel up rivers and canals. NOAA reports a historical example reaching 25 miles inland in some places; that is not a universal boundary.
Sources & context
Public guidance supports the principles in this article. The practical questions and examples are editorial interpretation, not a site assessment or a coverage decision. State-specific rules apply only where identified.
- NOAA: Flood basicsfederal weather guidance
- USGS: Rating curves and streamflowfederal hydrology guidance
- NOAA: Weather fatality and injury statisticsfederal weather data
- CDC: Floodwater safetyfederal public health guidance
- NOAA: Storm surge overviewfederal weather guidance
- National Weather Service: Storm surge overview and historical examplesfederal weather guidance
- National Weather Service: Flood preparednessprimary guidance
- FEMA: Flood Map Service Centerprimary guidance
- National Weather Service: Identifying tidal flood threats and address mapsfederal weather guidance