ISO data presented by the Insurance Information Institute show a weighted average of 1.50 water-damage-and-freezing claims per 100 insured house-years and $15,400 in incurred loss per claim for 2019–2023. These are historical figures for a defined policy population, not a forecast of a specific home’s risk or payout.
The 2019–2023 national figures
The Insurance Information Institute summarizes ISO data for homeowners multiple-peril policies. Its weighted 2019–2023 average for the combined water damage and freezing category was 1.50 claims per 100 house-years, with $15,400 in incurred loss per claim. One house-year is one dwelling insured for twelve months.
The calculation covers the specified HO-2, HO-3, HO-5 and North Carolina HE-7 policies; it excludes renters and condominium policies, Alaska, Texas and Puerto Rico. The figures are historical, not live 2026 observations. They are not specific to California, the Bay Area or any individual property.
Frequency and severity answer different questions
Claim frequency describes claims relative to insured exposure. A frequency of 1.50 per 100 house-years is an average over the data and period defined by the source; it is not a guaranteed probability for each home, nor does it include every leak that was never claimed. A property’s conditions and coverage can differ substantially.
Claim severity is an average of incurred losses per claim in this dataset, excluding loss-adjustment expenses. It is not the median, a standard repair estimate or a promise of payment after a deductible. A few large claims can affect an average, and the source category combines water damage with freezing.
What counts as water damage and freezing?
The statistical category groups water damage and freezing and may include mold damage when covered. It does not say every type of leak, mold or flood is covered by every policy. Different data providers may combine causes differently, so figures with similar names need not measure the same thing.
A burst supply pipe, gradual seepage, sewer backup and water from an outside flood can raise different policy questions. Ask the insurer how the specific source is classified and which exclusions, endorsements, deductibles and limits apply.
Why an average is not a local estimate
The scope of loss depends on the source, duration, materials, affected rooms and drying or reconstruction needs. Prices and coverage also vary by policy and location. A national insurance average should not be converted into a Bay Area quote or used to estimate the cost of a specific project.
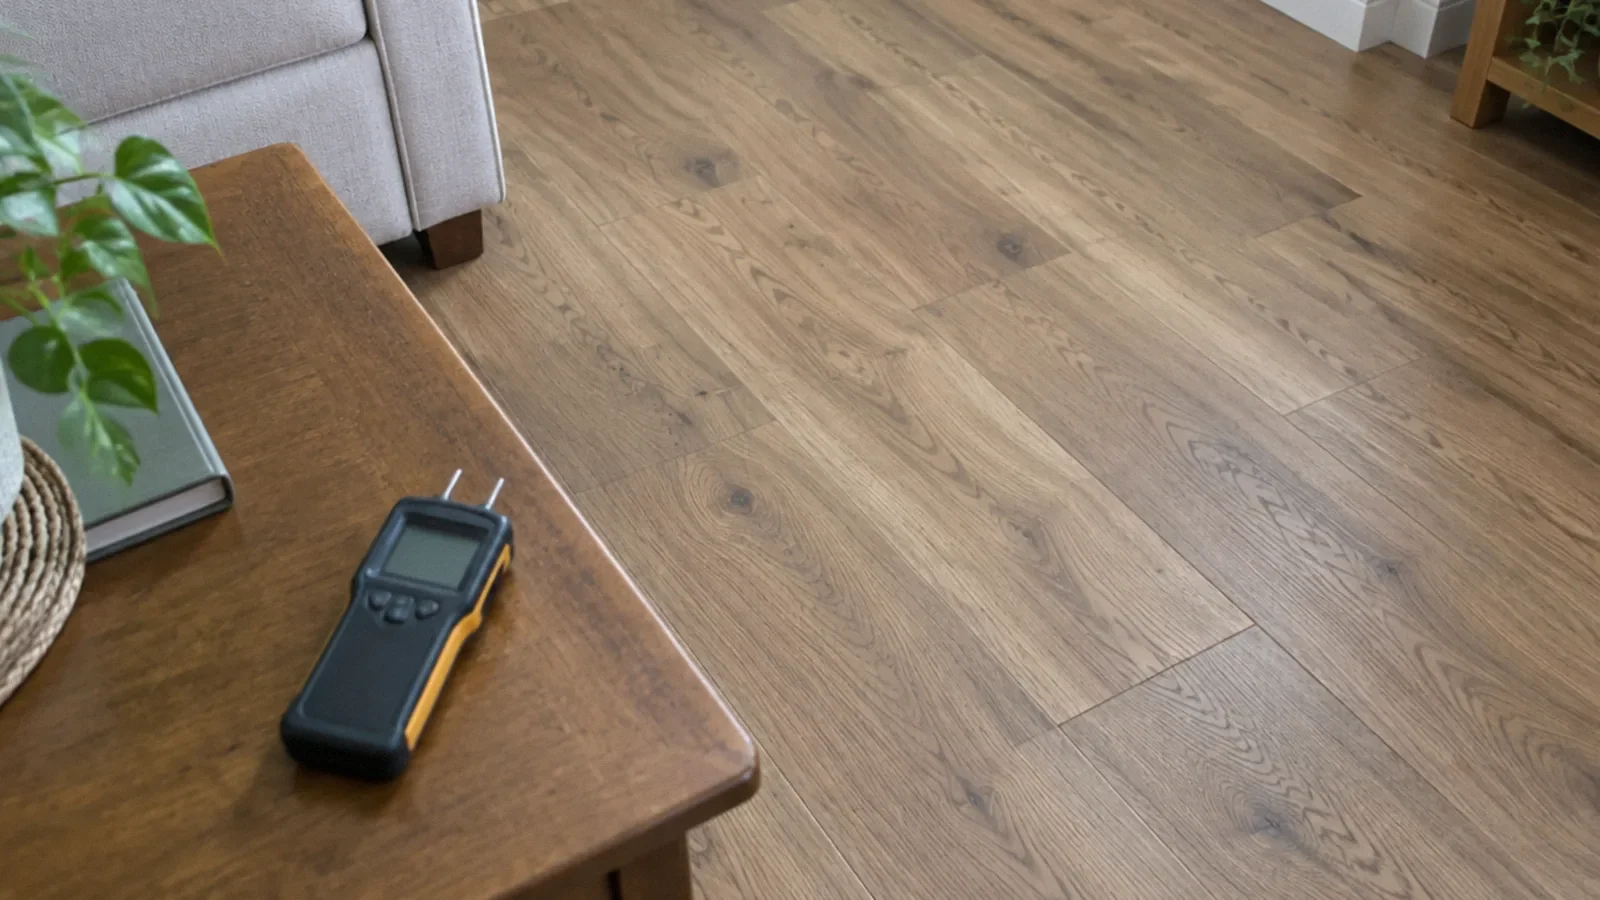
Request an inspection and a written scope from a qualified professional when the area is safe. If you are comparing estimates, check whether they include water extraction, drying, demolition, testing, repairs and contents handling rather than comparing totals alone.
What to do after an actual leak
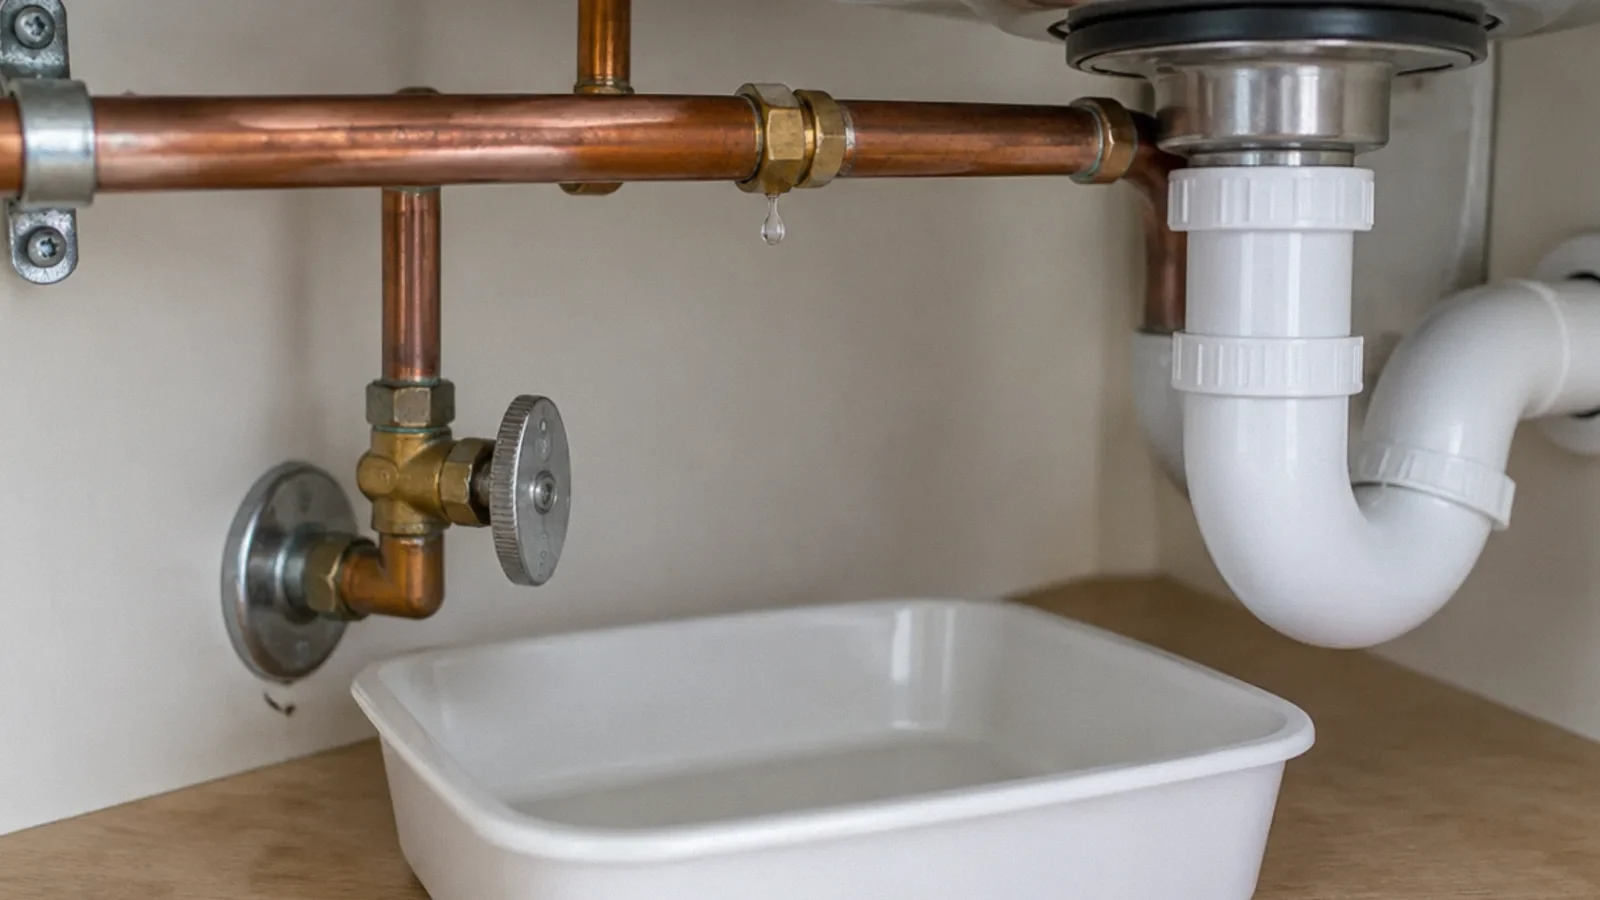
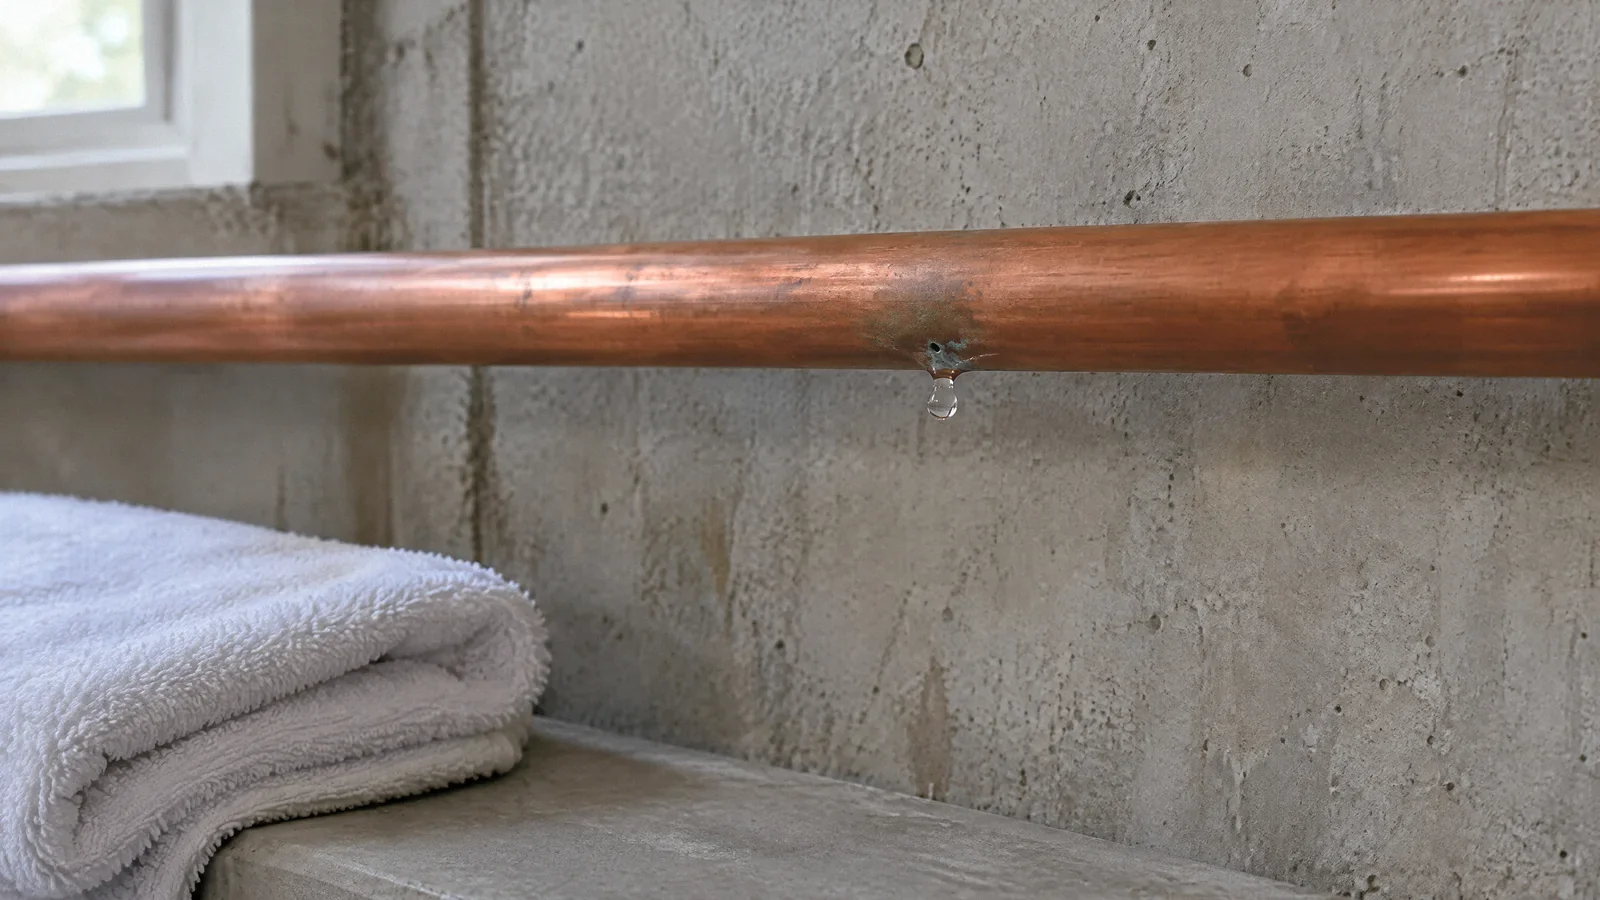
If it is safe, stop the water source or ask a plumber or utility for assistance. Keep away from water near electrical equipment, hot water and suspected contaminants. Promptly notify the insurer or property manager, document visible damage safely and ask how to arrange inspection.
Take reasonable temporary steps to prevent further loss, keeping dated photos, receipts and contractor reports. Do not delay emergency safety measures solely to take photographs. Coverage is determined by the policy, evidence and circumstances, not by the national claim average.
Understanding a coverage decision
The cost to fix a broken pipe, resulting damage to materials and the cost of temporary protection can be treated differently under a policy. Deductibles, limits and exclusions affect the outcome. A high national average does not mean the insurer will approve a particular item or pay that amount.
Ask for a written explanation and the policy language if a claim is limited or denied. Review the facts and submit relevant documents through the insurer’s process. The California Department of Insurance provides consumer information about residential property claims.
Use statistics to ask better questions
Before relying on an online number, check who collected the data, which years are included, the geography, the policy population, the loss definition and whether the figure is a mean, median, frequency or share of dollars. A different period or denominator can change the apparent conclusion.
For your own property, an inventory, accessible shutoff information and current policy documents can be more useful than an average alone. Review coverage with a licensed insurance professional, including any separate flood or backup protection relevant to your circumstances.
What these statistics do not count
These are insured homeowners claims, not a count of every leak or all water damage. Losses below deductibles, uninsured property, unreported damage and excluded causes may be missing. The figure is not a national estimate of all damaged buildings or an individual forecast.
Your next-step checklist
- Record the years, geography and policy population with any figure.
- Separate claim frequency from claim severity and share of losses.
- Do not treat national historical averages as a local repair estimate.
- Keep records and report an actual loss promptly.
- Review the policy and applicable exclusions with the insurer.
Related questions
How common are water damage insurance claims?
ISO data presented by the Insurance Information Institute show a weighted 2019–2023 average of 1.50 claims per 100 house-years in the combined water damage and freezing category for the specified policies.
What was the average water damage claim?
The same source reports $15,400 in incurred loss per claim for the combined category, weighted over 2019–2023. It is not a current quote or guaranteed payout.
Does the average include renters or every state?
No. The referenced table excludes renters and condominium policies, Alaska, Texas and Puerto Rico. Check the source for the full scope.
Does a water damage claim statistic prove my leak is covered?
No. Coverage depends on your policy, the source and the facts. Ask the insurer for a decision and policy basis.
Sources & context
Public guidance supports the principles in this article. The practical questions and examples are editorial interpretation, not a site assessment or a coverage decision. State-specific rules apply only where identified.
- Insurance Information Institute: Homeowners insurance facts and ISO loss dataindustry summary of ISO insurance data
- California Department of Insurance: Residential property claimsstate claims guidance
- NAIC: Homeowners insuranceinsurance regulator guidance